> ## Documentation Index
> Fetch the complete documentation index at: https://docs.beta.b3os.org/llms.txt
> Use this file to discover all available pages before exploring further.
# Forecasts charted in a sandbox, framed by render
An Open-Meteo action reads 72 hours for three places, pandas and matplotlib chart them in a sandbox with no network, and render frames the card in a laptop.
An action fetches the data, a sandbox does the analysis, render makes it presentable. The recipe calls
`io.b3os/open-meteo/get-hourly-forecast` for Tokyo, London and New York at once (Open-Meteo is keyless, so the calls
name no connection) and writes the three forecasts into a `code-interpreter` sandbox created with `egress: deny`:
the code that runs there has the data and nothing else to reach.
`run_code` reads the file into pandas, works out each place's low, high and rain over the 72 hours, and plots the
temperatures with matplotlib; the kernel returns the figure as a PNG alongside stdout. render takes an HTML card with
the chart inline as a data URI (it draws `html` with no network), puts it on the `ocean` background in the
`laptop-dark` device frame and returns the image. The sandbox is deleted before the card is drawn.
Verified 2026-11-01: this recipe's last run passed against `https://beta-api.b3os.org`, label `live-recorded` (recorded from production), from commit `29fca0d1`. The recipe harness runs it again, and a failed run takes this page out of the cookbook.
## Run it
**curl**
```bash
API=https://beta-api.b3os.org
AUTH="Authorization: Bearer $B3OS_API_KEY"
post() { curl -s "$API$1" -H "$AUTH" -H "Content-Type: application/json" -d @-; }
# 1. actions: 72 hours for each place
while IFS=, read -r name lat lon; do
jq -n --argjson lat "$lat" --argjson lon "$lon" \
'{ref: "io.b3os/open-meteo/get-hourly-forecast@1", input: {latitude: $lat, longitude: $lon, hours: 72}}' \
| post /v1/actions/call | jq --arg place "$name" '{place: $place} + .output.hours'
done <<'EOF' | jq -s . > forecast.json
Tokyo,35.68,139.69
London,51.51,-0.13
New York,40.71,-74.01
EOF
# 2. sandboxes: a code-interpreter sandbox with no network charts them
SBX=$(echo '{"template": "code-interpreter", "timeout_s": 180, "egress": {"mode": "deny"}}' | post /v1/sandboxes | jq -r .id)
curl -s -X PUT "$API/v1/sandboxes/$SBX/files?path=/workspace/forecast.json&mkdir=1" -H "$AUTH" \
-H "Content-Type: application/octet-stream" --data-binary @forecast.json > /dev/null
cat > chart.py <<'EOF'
import json
import matplotlib.pyplot as plt
import pandas as pd
rows = json.load(open("/workspace/forecast.json"))
fig, ax = plt.subplots(figsize=(11, 4.6), dpi=110)
for r in rows:
ax.plot(pd.Series(r["temperature"]), label=r["place"], linewidth=2.4)
ax.set_xlabel("hours from now")
ax.set_ylabel("°C")
ax.legend(frameon=False, ncol=3)
plt.show()
print(json.dumps([{"place": r["place"], "low": min(r["temperature"]), "high": max(r["temperature"])} for r in rows]))
EOF
jq -n --rawfile code chart.py '{code: $code, language: "python", timeout_ms: 60000}' \
| post "/v1/sandboxes/$SBX/run_code" > run.json
curl -s -X DELETE "$API/v1/sandboxes/$SBX" -H "$AUTH" > /dev/null
jq -r .stdout run.json
jq -r '.results[] | select(.mime_type == "image/png") | .data' run.json > chart.b64
# 3. render: the chart on a card, on a background in a laptop frame
jq -n --rawfile png chart.b64 '{
html: ("The next 72 hours
"
+ " "),
viewport: {width: 1280, height: 800}, full_page: true,
style: {background: "ocean", frame: "laptop-dark"}, format: "webp"}' \
| post /v1/render/screenshots | jq -r '.artifacts[0].url' | xargs curl -s -o card.webp
```
The recipe's `run.mjs` draws the full card: the three lines in a dark theme and each place's low, high and rain.
**TypeScript**
```ts
const API = "https://beta-api.b3os.org";
const auth = { authorization: `Bearer ${process.env.B3OS_API_KEY}` };
const call = async (method: string, path: string, body?: unknown): Promise =>
(
await fetch(`${API}${path}`, {
method,
headers: { ...auth, "content-type": "application/json" },
body: body === undefined ? undefined : JSON.stringify(body),
})
).json();
// 1. actions: 72 hours for each place, at once
const places = [
{ name: "Tokyo", latitude: 35.68, longitude: 139.69 },
{ name: "London", latitude: 51.51, longitude: -0.13 },
{ name: "New York", latitude: 40.71, longitude: -74.01 },
];
const forecast = await Promise.all(
places.map(async ({ name, latitude, longitude }) => {
const r = await call("POST", "/v1/actions/call", {
ref: "io.b3os/open-meteo/get-hourly-forecast@1",
input: { latitude, longitude, hours: 72 },
});
return { place: name, ...r.output.hours };
}),
);
// 2. sandboxes: a code-interpreter sandbox with no network charts them
const sbx = await call("POST", "/v1/sandboxes", { template: "code-interpreter", timeout_s: 180, egress: { mode: "deny" } });
await fetch(`${API}/v1/sandboxes/${sbx.id}/files?path=/workspace/forecast.json&mkdir=1`, {
method: "PUT",
headers: { ...auth, "content-type": "application/octet-stream" },
body: JSON.stringify(forecast),
});
const code = `
import json
import matplotlib.pyplot as plt
import pandas as pd
rows = json.load(open("/workspace/forecast.json"))
fig, ax = plt.subplots(figsize=(11, 4.6), dpi=110)
for r in rows:
ax.plot(pd.Series(r["temperature"]), label=r["place"], linewidth=2.4)
ax.set_xlabel("hours from now")
ax.legend(frameon=False, ncol=3)
plt.show()
print(json.dumps([{"place": r["place"], "low": min(r["temperature"]), "high": max(r["temperature"])} for r in rows]))
`;
const run = await call("POST", `/v1/sandboxes/${sbx.id}/run_code`, { code, language: "python", timeout_ms: 60000 });
await call("DELETE", `/v1/sandboxes/${sbx.id}`);
console.log(run.stdout);
const png: string = run.results.find((r: any) => r.mime_type === "image/png").data;
// 3. render: the chart on a card, on a background in a laptop frame
const shot = await call("POST", "/v1/render/screenshots", {
html: `
The next 72 hours
 `,
viewport: { width: 1280, height: 800 },
full_page: true,
style: { background: "ocean", frame: "laptop-dark" },
format: "webp",
});
console.log(shot.artifacts[0].url);
```
**Python**
```python
import json
import os
from concurrent.futures import ThreadPoolExecutor
import requests
API = "https://beta-api.b3os.org"
s = requests.Session()
s.headers["Authorization"] = f"Bearer {os.environ['B3OS_API_KEY']}"
PLACES = [("Tokyo", 35.68, 139.69), ("London", 51.51, -0.13), ("New York", 40.71, -74.01)]
# 1. actions: 72 hours for each place, at once
def hourly(place):
name, lat, lon = place
r = s.post(f"{API}/v1/actions/call", json={
"ref": "io.b3os/open-meteo/get-hourly-forecast@1",
"input": {"latitude": lat, "longitude": lon, "hours": 72},
}).json()
return {"place": name, **r["output"]["hours"]}
with ThreadPoolExecutor(3) as pool:
forecast = list(pool.map(hourly, PLACES))
# 2. sandboxes: a code-interpreter sandbox with no network charts them
sbx = s.post(f"{API}/v1/sandboxes", json={"template": "code-interpreter", "timeout_s": 180,
"egress": {"mode": "deny"}}).json()["id"]
s.put(f"{API}/v1/sandboxes/{sbx}/files", params={"path": "/workspace/forecast.json", "mkdir": 1},
data=json.dumps(forecast), headers={"Content-Type": "application/octet-stream"})
code = """
import json
import matplotlib.pyplot as plt
import pandas as pd
rows = json.load(open("/workspace/forecast.json"))
fig, ax = plt.subplots(figsize=(11, 4.6), dpi=110)
for r in rows:
ax.plot(pd.Series(r["temperature"]), label=r["place"], linewidth=2.4)
ax.set_xlabel("hours from now")
ax.legend(frameon=False, ncol=3)
plt.show()
print(json.dumps([{"place": r["place"], "low": min(r["temperature"]), "high": max(r["temperature"])} for r in rows]))
"""
run = s.post(f"{API}/v1/sandboxes/{sbx}/run_code",
json={"code": code, "language": "python", "timeout_ms": 60000}).json()
s.delete(f"{API}/v1/sandboxes/{sbx}")
print(run["stdout"])
png = next(r["data"] for r in run["results"] if r["mime_type"] == "image/png")
# 3. render: the chart on a card, on a background in a laptop frame
shot = s.post(f"{API}/v1/render/screenshots", json={
"html": '
The next 72 hours
'
f' ',
"viewport": {"width": 1280, "height": 800}, "full_page": True,
"style": {"background": "ocean", "frame": "laptop-dark"}, "format": "webp",
}).json()
print(shot["artifacts"][0]["url"])
```
**MCP**
On the remote [B3OS MCP server](/sdks/mcp) with `?packs=open-meteo`, ask your agent:
```text
Get the hourly forecast for the next 72 hours for Tokyo (35.68, 139.69), London (51.51, -0.13) and New York
(40.71, -74.01). Create a code-interpreter sandbox with egress denied and port 8080, write the three forecasts to
/workspace/site/forecast.json, and use run_code to plot the temperatures with pandas and matplotlib into
/workspace/site/chart.png, with an index.html that shows it. Serve /workspace/site on port 8080 in the background,
get a URL for the port, take a screenshot of it on the ocean background in the laptop-dark frame, delete the
sandbox and give me the image URL and each city's low and high.
```
The agent calls `open-meteo__get-hourly-forecast` three times, then `sandbox_create`, `sandbox_write_file`,
`sandbox_run_code`, `sandbox_exec`, `sandbox_port_url`, `render_screenshot` and `sandbox_delete`. It hands the chart
to render as the sandbox's preview URL rather than as a data URI, which would have to pass through the model.
The forecasts change every run; the places and the code do not. The card below is the last green run's, drawn in
production.
Weather data by [Open-Meteo.com](https://open-meteo.com/), under [CC BY 4.0](https://open-meteo.com/en/licence).
The card's chart and its lows, highs and rain totals are worked out from that data by the code above; Open-Meteo
does not endorse this recipe.
Owner: Docs. Products: Docs, Actions and triggers, Sandboxes, Render.
## Output of the last green run
**Command**
```bash
$ node run.mjs
# exit 0
```
**Outputs**
```json
{
"places": "Tokyo, London, New York",
"hours": 72,
"stats": [
{
"place": "Tokyo",
"low": 11.4,
"high": 20.8,
"rain_mm": 34.1
},
{
"place": "London",
"low": 8.2,
"high": 13,
"rain_mm": 0.1
},
{
"place": "New York",
"low": 7.1,
"high": 18.3,
"rain_mm": 0
}
],
"forecast_ms": 599.6,
"forecast_call_ms": [
599.5,
570.7,
548.8
],
"create_ms": 53.9,
"run_code_ms": 188.8,
"kernel_ms": 132.998,
"chart_bytes": 88266,
"deleted": true,
"render_status": "succeeded",
"render_ms": 157.8,
"card": "https://beta.b3os.org/gallery/recipes/forecast-chart-card/a756900d6bff8624.webp",
"card_bytes": 82604,
"total_ms": 1676.8
}
```
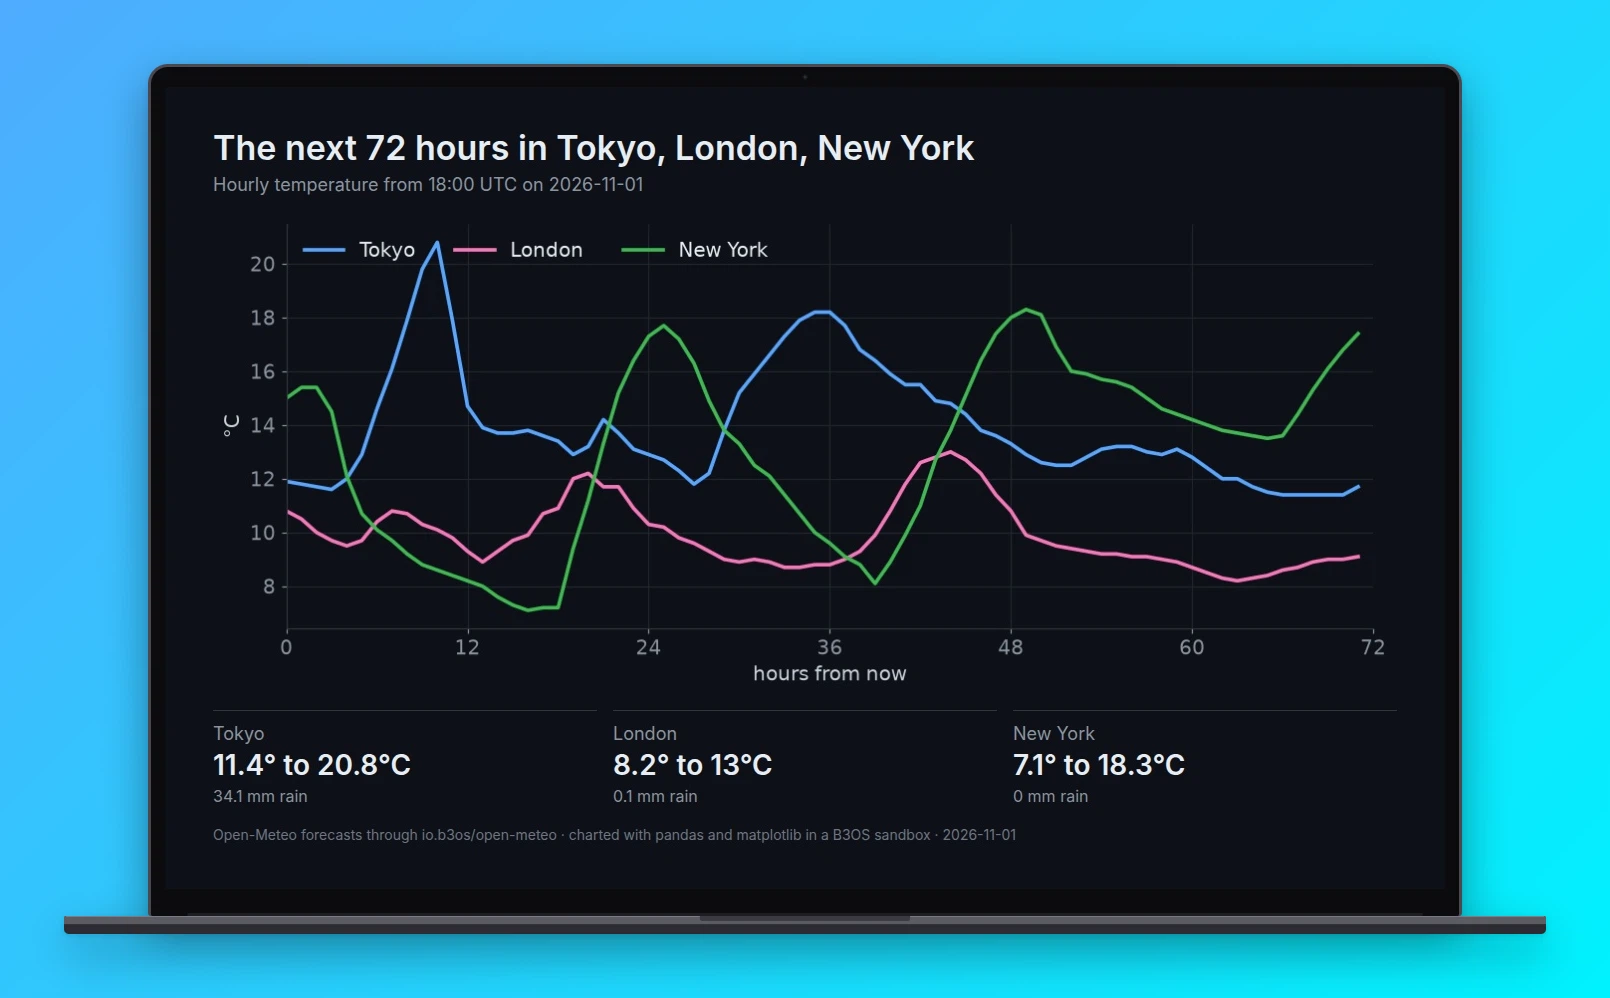
The outputs this recipe publishes (its recipe.json publish.outputs), with workspace identifiers redacted. The run's stdout, stderr and other outputs are not published.
Captured 2026-11-01 from commit `29fca0d1`, label `live-recorded` (recorded from production). Case `recipes/forecast-chart-card`.